

CM Design Space
Installation Performance Summary
BE‑TPP1100 | 14-day live performance snapshot
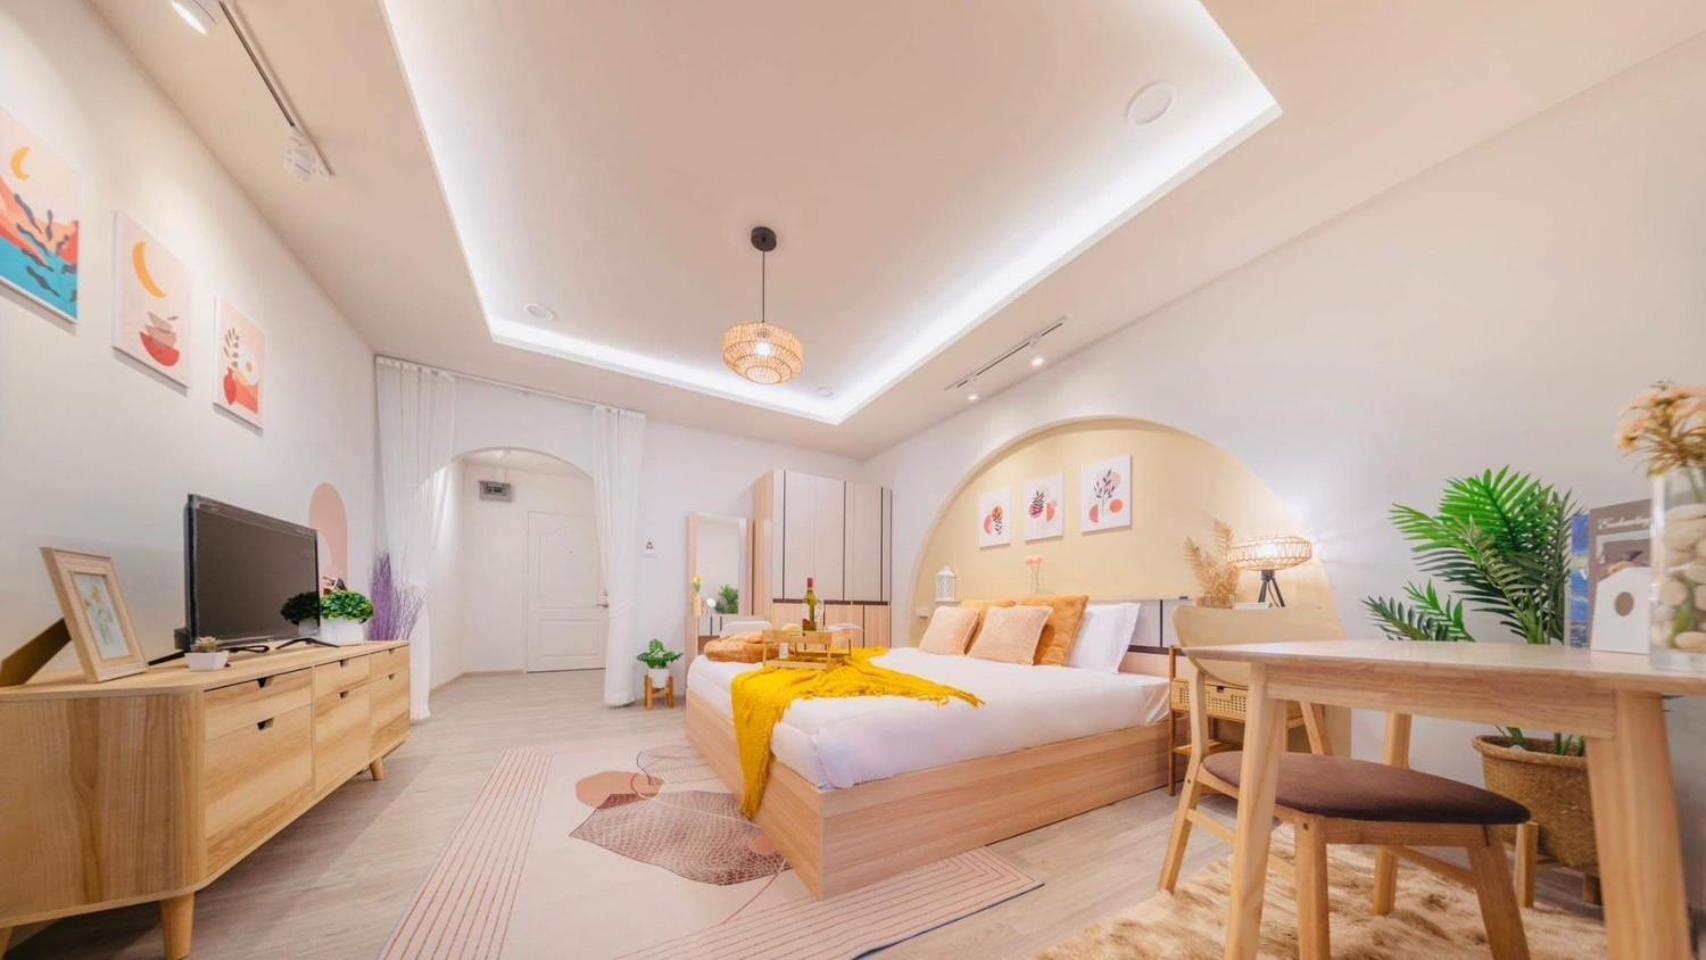
CM Space is a live proof-of-performance installation using a single BE‑TPP1100 mounted in the ceiling, with one supply duct delivering filtered air into the studio.
Based on the attached 14-day dashboard data, the unit is demonstrating strong real-world performance across air quality, control response, and system stability. PM2.5 remains below 10 ug/m3 for most of the period and is frequently below 5, with only brief transient spikes, indicating consistently strong particulate control in an occupied space.
CO2 sits on a healthy low baseline for much of the period, with short occupancy-led peaks that recover, showing the system is meaningfully supporting ventilation in a live studio environment. Fan speed modulates actively across a wide operating range rather than running flat, evidencing responsive control behaviour. Device telemetry is also stable, with continuous logging, steady Wi-Fi connectivity, and no visible signs of controller or thermal instability.
Key proof points
Install
1 x BE‑TPP1100, ceiling-mounted, single-duct supply
Air quality
PM2.5 mostly below 10 ug/m3 and often below 5; CO2 low in the background with short, recoverable peaks
Operation
Active fan-speed modulation, continuous data capture, stable Wi-Fi and controller health
Investor conclusion
This installation is a credible live proof point that a single, discreet BE‑TPP1100 can deliver measurable indoor air quality improvement in a premium wellness setting.
PM2.5 history
PM2.5 remains below 10 ug/m3 for most of the measured period and is frequently below 5. Short spikes are visible, but they are transient rather than sustained.

CO2 history
CO2 sits on a healthy low baseline for much of the period, with short peaks consistent with changes in room occupancy and class activity. These peaks recover rather than remaining elevated.

Fan speed and mode
Fan speed modulates across a broad operating range rather than staying fixed, showing that the unit is actively responding to live room conditions.

Temperature & humidity history
Temperature and humidity follow stable daily cycles, with no sign of erratic swings or environmental instability. Air quality is improving without compromising comfort.
EMA trends (PM2.5 & CO2)
The smoothed trend lines reinforce the same core pattern seen in the raw data: low particulate levels, manageable CO2 background, and predictable occupancy-related peaks.
Wi-Fi signal (RSSI)
Wi-Fi strength appears stable throughout the period, supporting reliable connectivity and uninterrupted data capture.
ESP temperature & heap
Controller temperature and memory remain stable, with no visible signs of thermal stress or software instability.